This section contains maps and resources sorted by focus areas. The information is a work in progress as of October 2022.
Come back later for more updates. We add them as more information becomes available.
This section contains maps and resources sorted by focus areas. The information is a work in progress as of October 2022.
Come back later for more updates. We add them as more information becomes available.
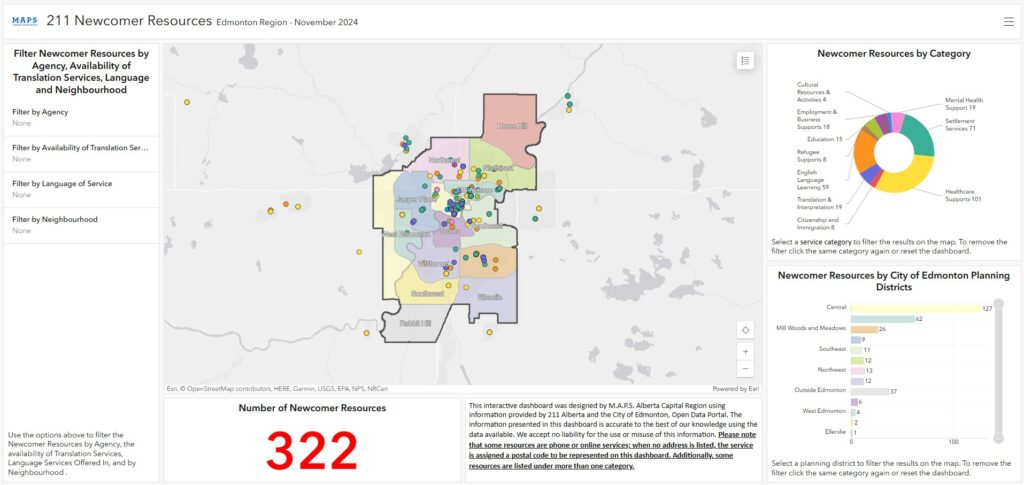
Newcomer Resources Interactive Dashboard
The Newcomer Resources Interactive Dashboard contains resource information from 211 Alberta. On the Dashboard, the graphs and data around the map change when you change the view of the map. To change the zoom of the map, you can hover your cursor over the map and scroll up and down. Within the map, you will see programs or dots. Clicking a dot will open a pop-up that identifies program details such as the name, address, description, eligibility requirements, and more. Sometimes, there may be more than one program at the one dot. To view the information for other programs, toggle the right and left arrows next to the “1 of ___” text at the bottom of the pop-up. You can filter the resources by clicking the categories/pie slices or planning districts/bars. The map will change as you click through the pie slices/planning districts. To remove a filter, click the same pie section or district again. Additional filters can be found on the left side of the map. Use these to filter the resources as desired. The Dashboard is very interactive and is best viewed on a laptop or desktop with internet access.
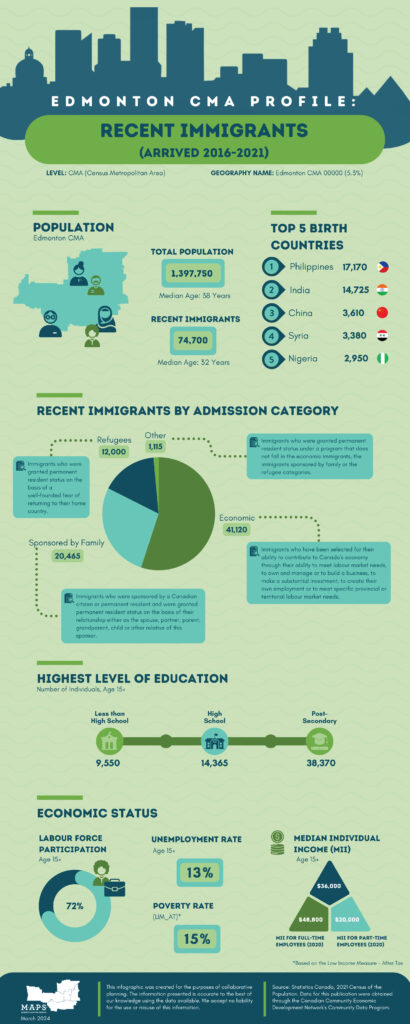
Recent Immigrant Infographic
This infographic presents data from Statistics Canada’s 2021 Census of Population, focusing on recent immigrants to the Edmonton Census Metropolitan Area who arrived between 2016 and 2021. Click the image or link to view or download the infographic.
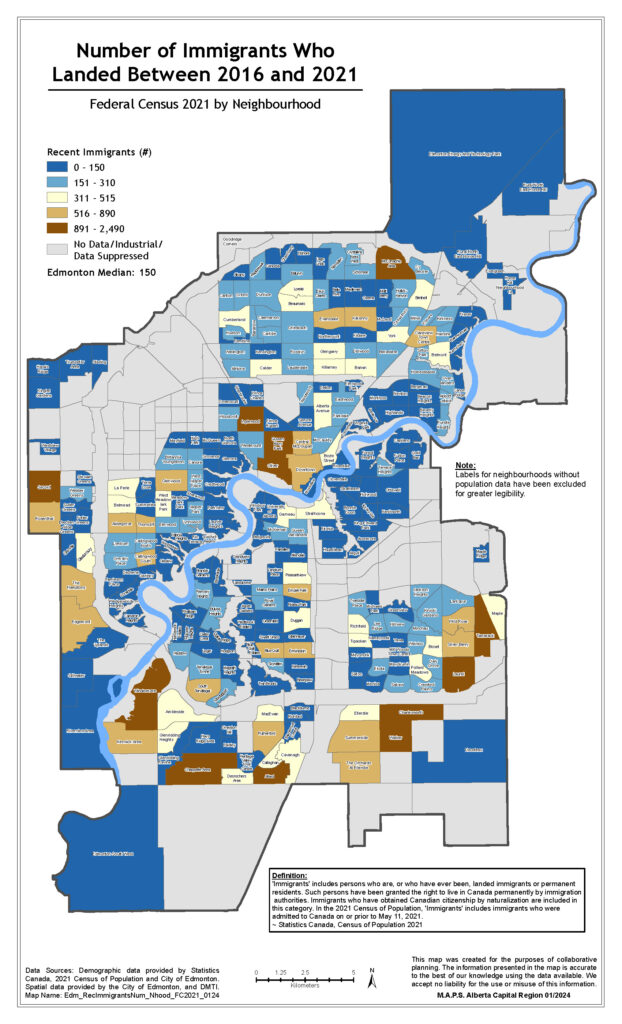
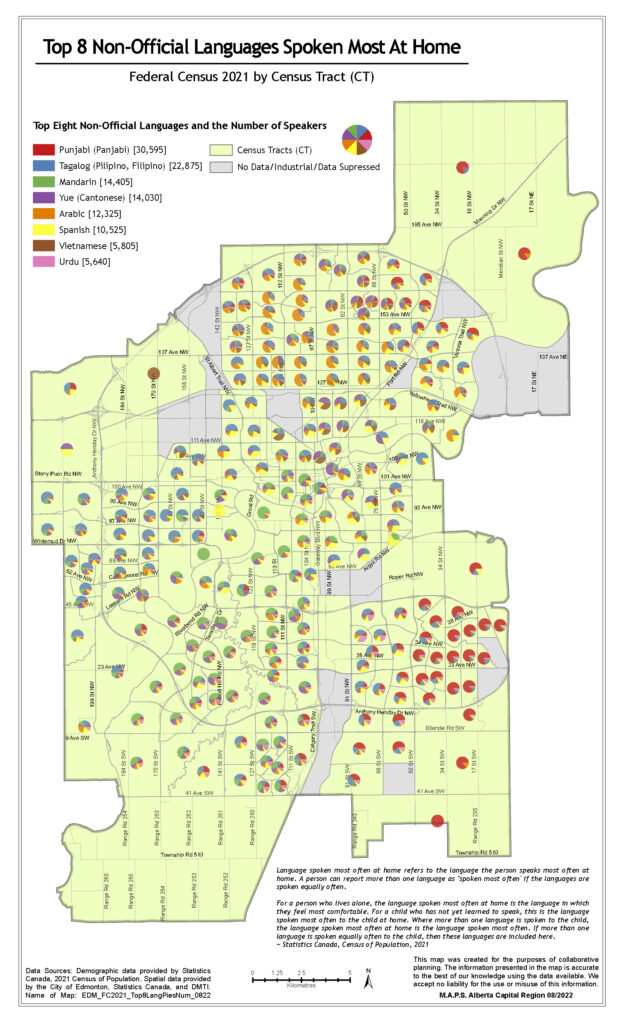
Immigration and Language Maps
The Immigration and Language maps showcase data from Statistics Canada’s 2021 Census of Population for the City of Edmonton. The immigration maps depict immigration status and admission category by neighborhood, while the language maps highlight the top eight non-official languages most commonly spoken at home, along with data on French speakers and individuals who speak neither official language. Language data is presented by Census Tract. Click the images or links to view or download the maps.
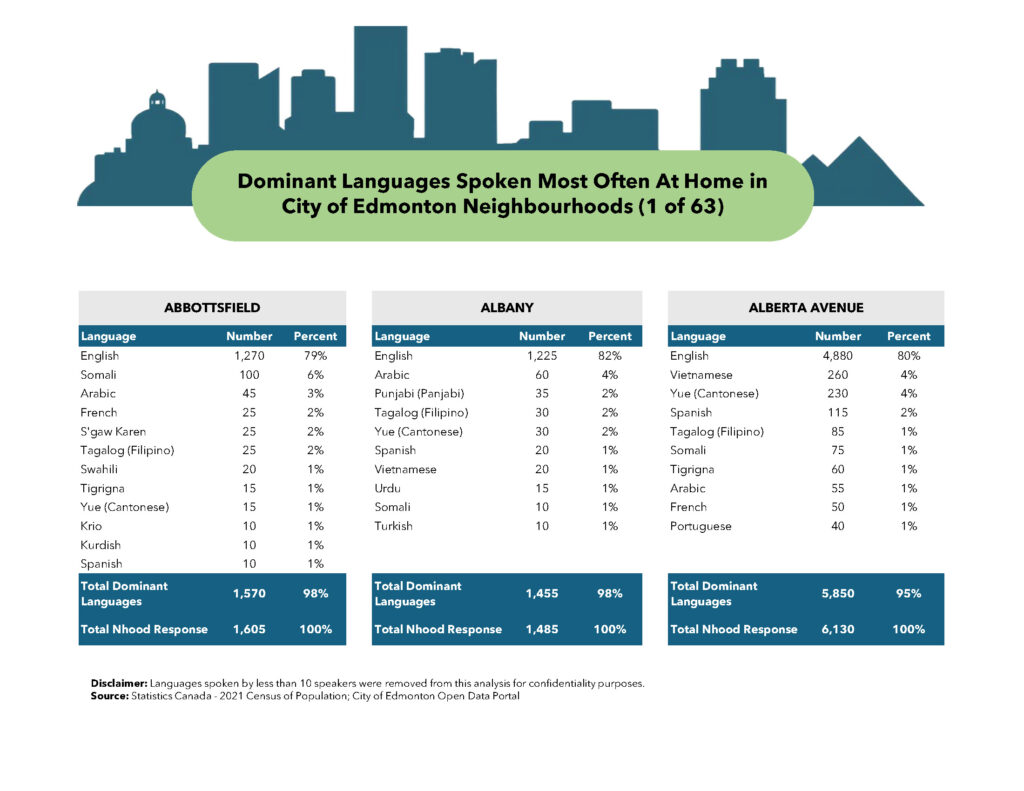
Dominant Languages by Neighbourhood
This document presents the languages spoken most often at home in City of Edmonton Neighbourhoods. For confidentiality, languages spoken by fewer than 10 individuals have been excluded from this analysis. The data is sourced from Statistics Canada’s 2021 Census of Population and the City of Edmonton Open Data Portal. Click the image or link to view or download the file.
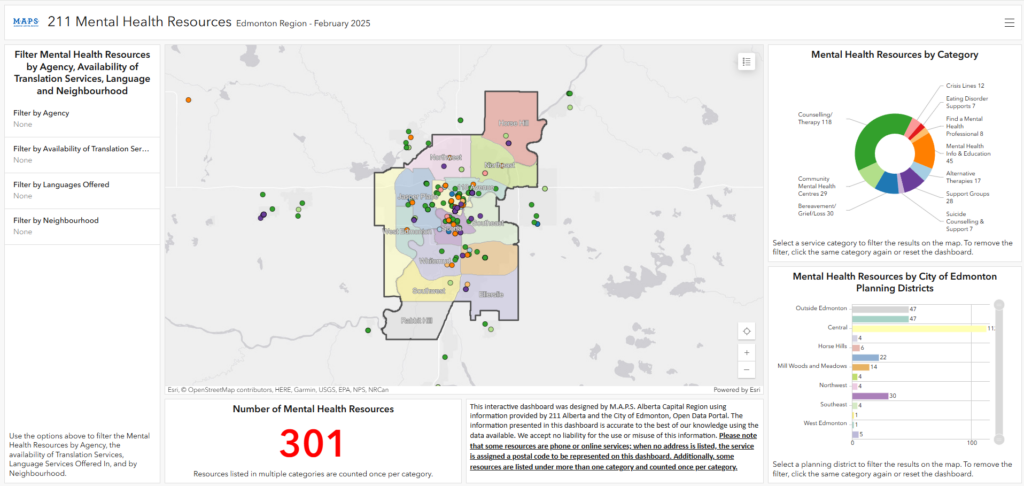
Mental Health Resources Dashboard
The Mental Health Resources Interactive Dashboard contains resource information from 211 Alberta. On the Dashboard, the graphs and data around the map change when you change the view of the map. To change the zoom of the map, you can hover your cursor over the map and scroll up and down. Within the map, you will see programs or dots. Clicking a dot will open a pop-up that identifies program details such as the name, address, description, eligibility requirements, and more. Sometimes, there may be more than one program at the one dot. To view the information for other programs, toggle the right and left arrows next to the “1 of ___” text at the bottom of the pop-up. You can filter the resources by clicking the categories/pie slices or planning districts/bars. The map will change as you click through the pie slices/planning districts. To remove a filter, click the same pie section or district again. Additional filters can be found on the left side of the map. Use these to filter the resources as desired. The Dashboard is very interactive and is best viewed on a laptop or desktop with internet access.

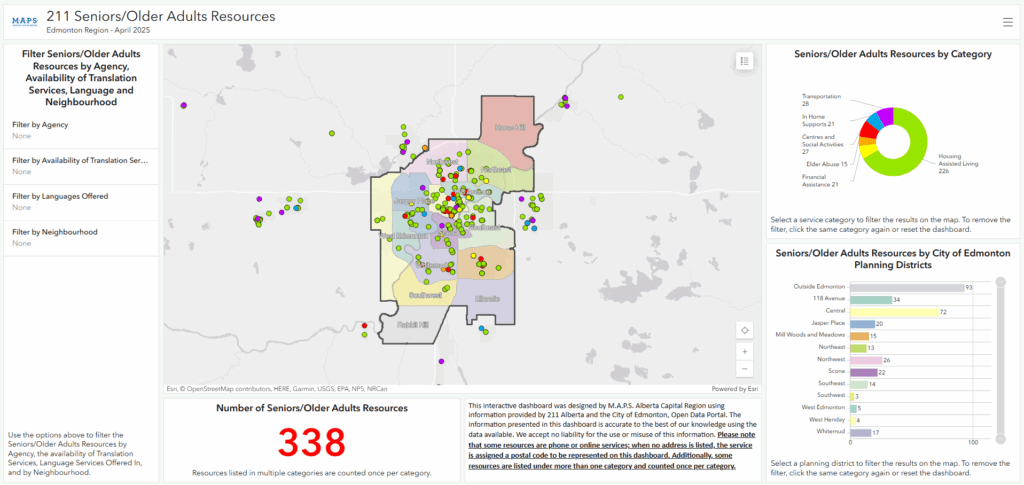
211 Seniors Resources Dashboard
The Seniors and Older Adult Resources Interactive Dashboard contains resource information from 211 Alberta. On the Dashboard, the graphs and data around the map change when you change the view of the map. To change the zoom of the map, you can hover your cursor over the map and scroll up and down. Within the map, you will see programs or dots. Clicking a dot will open a pop-up that identifies program details such as the name, address, description, eligibility requirements, and more. Sometimes, there may be more than one program at the one dot. To view the information for other programs, toggle the right and left arrows next to the “1 of ___” text at the bottom of the pop-up. You can filter the resources by clicking the categories/pie slices or planning districts/bars. The map will change as you click through the pie slices/planning districts. To remove a filter, click the same pie section or district again. Additional filters can be found on the left side of the map. Use these to filter the resources as desired. The Dashboard is very interactive and is best viewed on a laptop or desktop with internet access.

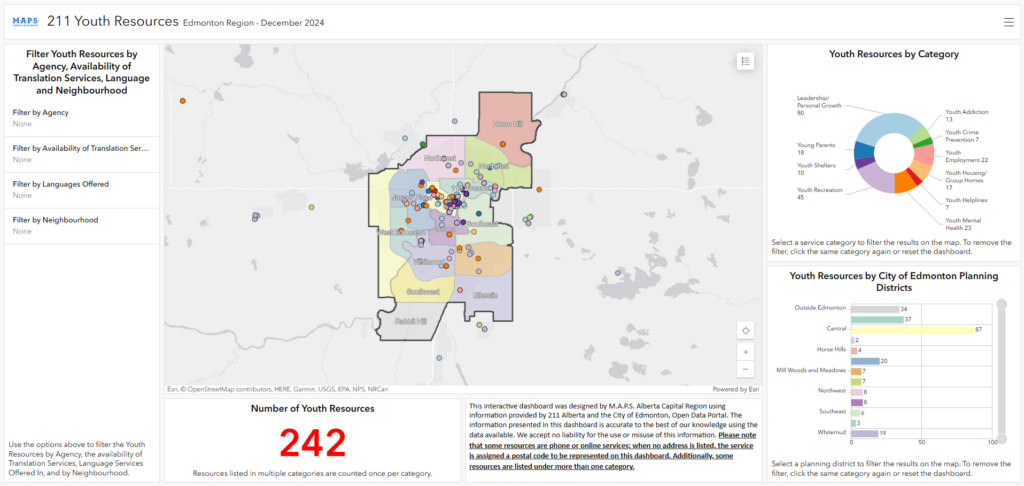
211 Youth Resources Dashboard
The Youth Resources Interactive Dashboard contains resource information from 211 Alberta. On the Dashboard, the graphs and data around the map change when you change the view of the map. To change the zoom of the map, you can hover your cursor over the map and scroll up and down. Within the map, you will see programs or dots. Clicking a dot will open a pop-up that identifies program details such as the name, address, description, eligibility requirements, and more. Sometimes, there may be more than one program at the one dot. To view the information for other programs, toggle the right and left arrows next to the “1 of ___” text at the bottom of the pop-up. You can filter the resources by clicking the categories/pie slices or planning districts/bars. The map will change as you click through the pie slices/planning districts. To remove a filter, click the same pie section or district again. Additional filters can be found on the left side of the map. Use these to filter the resources as desired. The Dashboard is very interactive and is best viewed on a laptop or desktop with internet access.
COVID-19 Posters